Now that you have your experiment, and run through it, it’s time to take a look at the data. For Eyelink experiments, we use Data Viewer to output the eye-tracking data.
Let’s start by opening up Data Viewer. The default view will look like the image below.
Note how you don’t have any data open just yet. Let’s import something! Begin by downloading the experiment we made earlier in the course by clicking here.
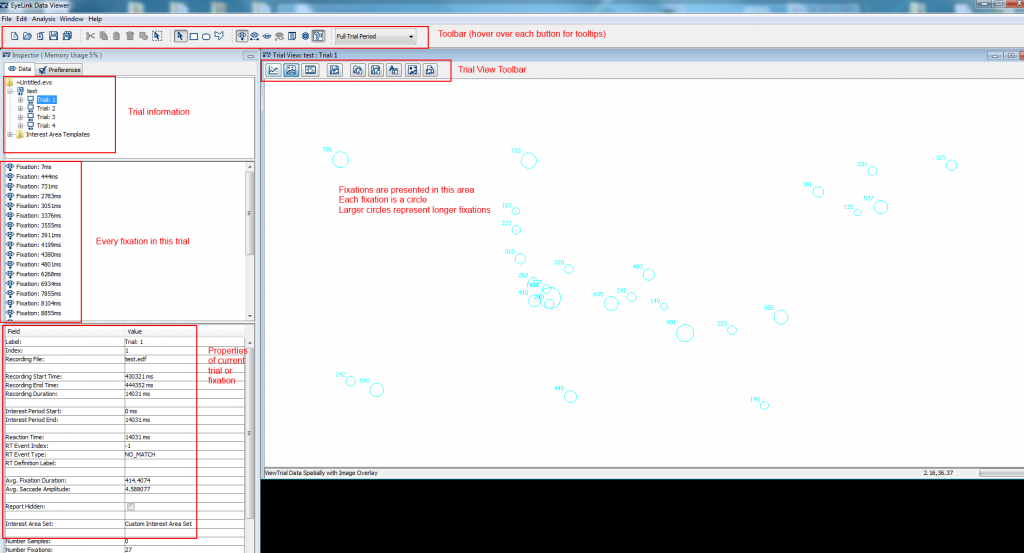
Once you have downloaded and then unzipped the file, go File>Import Data>Multiple Eyelink Files>. The option to import multiple files is really very helpful as it enables you to import the data for a whole experiment at once. When you have imported your data, you’ll get a view of the first trial in the study. On the left you have trial-by-trial information for the experiment. Here, we only have a few trials. Browse through them like in the animation below!

There’s a wealth of helpful information on display here. Below is a diagram of the important parts.
Let’s move on to messages and trial periods next.

