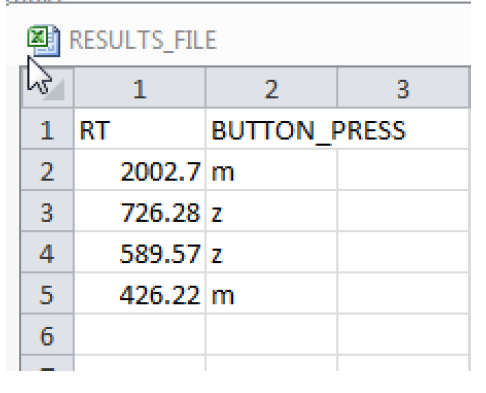
Build and Test Run the experiment again. You’ll get all four images/trials in a random order. If you take a look at the results file generated, you’ll see you have the RT and BUTTON_PRESS variables (as shown below), but not the other columns from your Datasource. In other words you have one row per trial BUT you don’t know what each condition and each trial refers to, or which image was shown on each trial. You will want to add that information to the results output.
To add the information from your datasource into the RESULTS_FILE you need to first of all click on RESULTS_FILE. In the Properties panel, click on Columns as you did before – we used it earlier when setting up the RT and BUTTON_PRESS output. You’ll see that all the columns in your datasource are now listed on the left, in the Available Variables pane. Select these and move them over to the Selected Variables pane and they will be included in your RESULTS_FILE. See below for an example.

If you Build and Test Run, you’ll see the rest of the columns are now included in your output.

