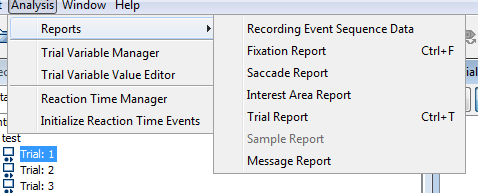
Data Viewer can generate a wide variety of different reports which can be used for analysing your data in different ways. To generate a report, go Analysis>Reports> and you will see the different report types as shown below.
You can then select which columns to use as output for each report. There are a huge number of different columns that are automatically generated for each report type. This is really very helpful when it comes to analysing our data. Here’s a brief outline of what each report type will give you – we will go into these in more detail later. We’ll leave out the report types that don’t get used very often.
For more information on what each column in each report gives you, the Data Viewer manual is really very helpful indeed.
1. Fixation Report
The Fixation Report gives you one row of data for every fixation in your study. You will typically need to use the fixation report if you are running visual search/scene perception studies. This is because, for studies of this type, you’ll often want to filter out fixations that coincide with other events, such as display changes, button-press responses, etc.
Note that this can technically be done by modifying the interest period using Data Viewer, but doing so can sometimes end up removing fixations that you actually want to keep. For example, you still want to keep fixations that coincided with a button-press response if you’re studying visual search, as that will then enable you to get measures like verification time (i.e., the time between fixating a target object and pressing the button).
Fixation reports are also useful for visual search experiments as typically, in visual search, the interest areas are set to be the exact size of the objects in the display. Since participants often land outside this area, we can reprocess the fixation report (using R) to effectively extend the size of the interest areas and capture fixations that fell ‘just outside’ an interest area.
2. Interest Area Report
The Interest Area Report gives you one row of data for every interest area in your study. This enables you to get detailed information about a given interest area very rapidly. Reading researchers typically use this type of report since they won’t want to expand the size of interest areas (as in fixation reports) or worry about button-press responses (as in visual search), since the analyses primarily focus upon behaviour in relation to a single target word. They typically change the interest period to be set to the time period of the trial itself, enabling the filtering out of any unnecessary fixations.
3. Message Report
The Message Report gives you one row of data for every message that occurred during the study. If you want an accurate view of when things happened during your study, the message report is the one to use. This is particularly important for gaze-contingent studies where display changes occur. You can technically get most of the messages that occur from the fixation report. However, some messages do get missed from the fixation report. These include messages that are sent when (1) the eye is not being tracked and (2) during blinks. As a consequence, the fixation report is not a ‘perfect’ measure of when events happened, and the message report is a more reliable source of timing information.
4. Sample Report
The Sample Report gives you one row of data for every sample recorded by the eye-tracker during the study. If you have your Eyelink running at 1000Hz, that gives you 1,000 rows of data per second of recording. As a consequence, sample reports are very large indeed, and it’s not uncommon for all the sample reports for a given study to consist of tens of millions of rows of data. You’ll only need to use a sample report if you have certain highly customised setups (e.g., moving displays) or want to get an idea of millisecond-by-millisecond pupil size (as is the case in pupillometry).
